Personal tools
Document Actions
PGI Workstation User's Guide - 14 The PGPROF Profiler
 << " border=0>
 > " border=0>


14 The PGPROF Profiler
This chapter introduces the PGPROF profiler. The profiler is a tool that analyzes data generated during execution of specially compiled C, C++, F77, F90 and HPF programs. The PGPROF profiler allows users to discover which functions and lines were executed as well as how often they were executed and how much of the total time they consumed.
The PGPROF profiler also allows you to select processor information about HPF programs on multiprocessor systems. The multiprocessor information allows you to select combined minimum and maximum processor data, or to select processor data on a processor by processor basis. This information can be used to identify communications patterns, and identify the portions of a program that will benefit the most from performance tuning.
14.1 Introduction
Profiling is a three step process:
- Compilation
- Compiler switches cause special profiling calls to be inserted in the code and data collection libraries to be linked in.
- Execution
- The profiled program is invoked normally, but collects call counts and timing data during execution. When the program terminates, a profile data file is generated (pgprof.out ).
- Analysis
- The PGPROF tool interprets the pgprof.out file to display the profile data and associated source files. The profiler supports function level and line level data collection modes. The next section provides definitions for these data collection modes.
14.1.1 Definition of Terms
- Function Level Profiling
Is the strategy of collecting call counts and execution times on a per function basis.Line Level Profiling
Execution counts and times within each function are collected in addition to function level data. Line Level is somewhat of a misnomer because the granularity ranges from data for individual statements to data for large blocks of code, depending on the optimization level. At optimization level 0, the profiling is truly line level.Basic Block- At optimization levels above 0, code is broken into basic blocks, which are groups of sequential statements without any conditional or looping controls. Line level profile data is collected on basic blocks rather than individual statements at these optimization levels.Virtual Timer A statistical method for collecting time information by directly reading a timer which is being incremented at a known rate on a processor by processor basis.
- Data Set
- A profile data file is considered to be a data set.Host
- The system on which the PGPROF tool executes. This will generally be the system where source and executable files reside, and where compilation is performed.Target Machine
- The system on which a profiled program runs. This may or may not be the same system as the host.
- The system on which the PGPROF tool executes. This will generally be the system where source and executable files reside, and where compilation is performed.Target Machine
- GUI
- Graphical User Interface. A set of windows, and associated menus, buttons, scrollbars, etc., that can be used to control the profiler and display the profile data.
14.1.2 Compilation
The following list shows driver switches which cause profile data collection calls to be inserted and libraries to be linked in the executable file:
- -Mprof=func
- insert calls to produce a pgprof.out file for function level data.
- -Mprof=lines
- insert calls to produce a pgprof.out file which contains both function and line level data.
14.1.3 Program Execution
Once a program is compiled for profiling, it needs to be executed. The profiled program is invoked normally, but while running it collects call counts and/or time data. When the program terminates, a profile data file called pgprof.out is generated.
14.1.4 Profiler Invocation and Initialization
Running the PGPROF profiler allows the profile data produced during the execution phase to be analyzed and initializes the profiler.
The PGPROF profiler is invoked as follows:
% pgprof [options] [-I srcdir] [datafile]
If invoked without any options or arguments, the PGPROF profiler looks for the pgprof.out data file and the program source files in the current directory. The program executable name, as specified when the program was run, is usually stored in the profile data file. If all program related activity occurs in a single directory, the PGPROF profiler needs no arguments. If present, the arguments are interpreted as follows:
- -s
- Read commands from standard input. On hosts which have a GUI, this causes PGPROF to operate in a non-graphical mode. This is useful if input is being redirected from a file or if the user is remotely logged in to the host system.
- -Isrcdir
Add a directory to the source file search path. The PGPROF profiler will always look for a program source file in the current directory first. The -I option can be used multiple times to append additional directories to the search path. Directories will be searched in the order specified. It is acceptable to leave white space between the -I and the srcdir arguments.- datafile
A single datafile name may be specified on the command line.
An initialization file named .pgprofrc may be placed in the current directory. The data in this file will be interpreted as command line arguments, with any number of arguments per line. A word beginning with # is a comment and causes the rest of the line to be ignored. A typical use of this file would be to specify multiple source directories. The .pgprofrc file is read after the command line arguments have been processed. Any arguments provided on the invocation line will override conflicting arguments found in the .pgprofrc file.
14.1.5 Data Interpretation
The PGPROF data collection libraries now employ a single unified method for gathering time information - Virtual Timer - rather than the three methods previously supported.
14.1.6 Virtual Timer
This data collection method employs a single timer, which starts at zero (0) and is incremented at a fixed rate while the active program is being profiled. For multiprocessor programs, there is a timer on each processor, and the profiler's summary data (minimum, maximum and per processor) is based on each processor's time to run a function. How the timer is incremented and at what frequency depends on the target machine. The timer is read from within the data collection functions and is used to accumulate COST and TIME values for each line, function, and the total execution time. The line level data is based on source lines; however, in some cases, there may be multiple statements on a line and the profiler will show data for each statement.
NOTE: due to the timing mechanism used by the profiler to gather data, information provided for longer running functions will be more accurate than for functions that only execute for a short percentage of the timer's granularity. Refer to the list of Caveats below for more profiler limitations.
14.1.7 Profile Data
The following statistics are collected and may be displayed by the PGPROF profiler.
- BYTES
For HPF profiles only. This is the number of message bytes sent and
received by the function or line.
- BYTES RECEIVED
For HPF profiles only. This is the number of bytes received by the function or line in a data transfer.- BYTES SENT For HPF profiles only. This is the number of bytes sent by the function or line.
- CALLS This is the number of times a function is called.
- COST This is the sum of the differences between the timer value entering and exiting a function. This includes time spent on behalf of the current function in all children whether profiled or not.
- COUNT This is the number of times a line or function is executed.
- COVERAGE This is the percentage of lines in a function that were executed at least once.
- LINE NUMBER For line mode, this is the line number for that line. For function mode, this is the line number of the first line of the function.
- MESSAGES For HPF profiles only. This is the number of messages sent and received by the function or line.
- RECEIVES For HPF profiles only. This is the number of messages received by the function or line.
- SENDS For HPF profiles only. This is the number of messages sent by the function or line.
- STMT ON LINE For programs with multiple statements on a line, data is collected and displayed for each statement individually.
- TIME This is only the time spent within the function or executing the line. The TIME does not include time spent in functions called from this function or line. TIME may be displayed in seconds or as a percent of the total time.
- TIME PER CALL This is the TIME for a function divided by the CALLS to that function. TIME PER CALL is displayed in milliseconds.
- BYTES RECEIVED
The data provided by virtual timer profiling based collection allows you to analyze relationships between functions and between processors.
14.1.8 Caveats
Collecting performance data for programs running on high speed processors and parallel processors is a difficult task. There is no ideal solution. Since programs running on these processors tend to operate within large internal caches, external hardware cannot be used to monitor their behavior. The only other way to collect data is to alter the program itself, which is how this profiling process works. Unfortunately, it is impossible to do this without affecting the temporal behavior of the program. Every effort has been made to strike a balance between intrusion and utility, and to avoid generating misleading or incomprehensible data. It would, however, be unwise to assume the data is beyond question.
14.1.8.1 Clock Granularity
Many target machines provide a clock resolution of only 20 to 100 ticks per second. Under these circumstances a function must consume at least a few seconds of CPU time to generate meaningful line level times.
14.1.8.2 Optimization
At higher optimization levels, and especially with highly vectorized code, significant code reorganization may have occurred within functions. Most line profilers deal with this problem by disallowing profiling above optimization level 0. The PGPROF profiler allows line profiling at any optimization level, and significant effort was expended on associating the line level data with the source in a rational manner and avoiding unnecessary intrusion. Despite this effort, the correlation between source and data may at times appear inconsistent. Compiling at a lower optimization level or examining the assembly language source may be necessary to interpret the data in these cases.
14.2 X-Windows Graphical User Interface
The PGPROF X-Windows Graphical User Interface (GUI) is invoked using the command pgprof. This chapter describes how to use the profiler with the GUI on systems where it's supported. There may be minor variations in the GUI from host to host, depending on the type of monitor available, the settings for various defaults and the window manager used. Some monitors do not support the color features available with the PGPROF GUI. The basic interface across all systems remains the same, as described in this chapter, with the exception of the differences tied to the display characteristics and the window manager used.
There are two major advantages provided by the PGPROF GUI.
- Source Interaction
The PGPROF GUI allows a user to view the program source for any known function in the line profiler window whether or not line level profile data is available simply by selecting the function name. Since interpreting profile data usually involves correlating the program source and the data, the source interaction provided by the GUI greatly reduces the time spent interpreting data. The GUI allows users to easily compare data on a per processor basis, and identify problem areas of code based on processor execution time differences for functions or lines.- Graphical Display of Data
It is often difficult to visualize the relationships between the various percentages and execution counts. The GUI allows bar graphs to be displayed which graphically represent these relationships. This makes it much easier to locate the 'hot spots' while scrolling through the data for a large program. - Graphical Display of Data
14.2.1 Command Line Switches And X-Windows Resources
PGPROF command line switches may be used to control some features of the GUI. These command line switches may be used when the PGPROF profiler is invoked.
- -bg <color>
- sets the display background color to color; the default is set by the Motif libraries. For example: -bg blue
- -fg <color>
- sets the display foreground color to color; the default is set by the Motif libraries. For example: -fg black
- -bar <num>
- sets the width of bar graphs to num, in number of characters.
- -source <num>
- sets the number of characters of the source program to display for line level data to num.
- -file <num>
- sets the number of characters of the filename to display to num.
- -high <color>
- -medium <color>
- -low <color>
- -verylow <color>
- -medium <color>
Bar graphs are divided into four groups by length, at 25%, 50% and 75% of the longest bar. These bar coloring options (-high, -medium, -low and -verylow) let you set the color to use for these four bar groups.- -title <string>
- sets the window title to string.
Normal X-windows switches may also be used, such as -display and -geometry.
In addition to normal X-windows resources, PGPROF uses the following resources, which can be set with the xrdb command.
- pgprof.bar: num
- equivalent to -bar num
- pgprof.source: num
- equivalent to -source num
- pgprof.filename: num
- equivalent to -file num
- pgprof.high: color
- equivalent to -high color
- pgprof.medium: color
- equivalent to -medium color
- pgprof.low: color
- equivalent to -low color
- pgprof.verylow: color
- equivalent to -verylow color
- pgprof.foreground: color
- pgprof.background: color
equivalent to -bg color- pgprof.browser: path
- sets the path to the web browser used to browse the help page.
- pgprof.helppage: http-address
the http-address of the PGPROF HTML help page.- pgprof.browserdirect: command
a printf format string used to construct the
arguments to the browser; use %s (percent signs)
where the http-address should appear.
14.2.2 Using the PGPROF X-Windows GUI
The profiler window is divided into five areas from top to bottom, as follows: the Menu Bar area, the Title area, the Sort/Select area, the Display area and the Messages area. The illustration in figure 14-1 depicts a function-level profile window.
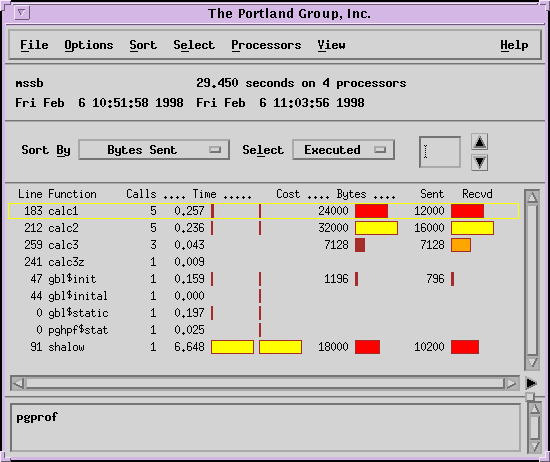
Figure 14-1
The Menu Bar contains File, Options, Sort, Select, Processors, View and Help menus. Any of these menus can be selected with a mouse click or by keyboard shortcuts. For example, use Alt+F for File. All menus have tear-off mode enabled. This is performed by clicking on the dashed line on the top of each menu.
The Title area displays the name of the executable as well as the date and time the executable was created. To the right, it also displays the total execution time of the run, the number of processes or processors it used and the date and time of the run.
The Sort/Select area allows you to re-sort the functions or select subsets of the functions based on time, cost, coverage, or other properties; line mode windows do not have a Sort/Select area.
The Messages area contains a scrollable display with informational messages from the PGPROF profiler.
14.2.2.1 File Menu
The File menu permits the following actions:
- Open <Ctrl+O>
- Opens a file-selection window to allow you to select a new profiler output file to display. The new data is displayed in a new window.
- Merge
- Opens a file-selection window to allow you to select a profiler output file to merge with the current file. The merged execution times are added for each function and line. The merged file must have been created with the same program and executable.
- Sends the data in the Display area to a printer
- Print to File
Prints the data in the Display area to a file.- Append to File
Appends the data in the Display area to the file most recently created by the Print to File action.- Close <Ctrl+C>
Closes the current PGPROF window.- Quit <Ctrl+Q>
Closes all PGPROF windows and exits the application.
14.2.2.2 Options Menu
The Options menu controls the following options:
- Printer Options
Allows you to select the printer command used for the Print action. The default is "lpr".- Help Options
Allows you to change the path to the browser and help page used for interactive help.- Source Directory
Allows you to add another directory to the search path for source files.
14.2.2.3 Sort Menu And The Sort Option Box
The Sort menu and the Sort option box in the Sort/Select area allow you to sort the functions by any of several keys. The Sort menu and Sort option box give the same functionality. The Sort menu is not available for line-level windows. The sort keys are:
- Name
- function name (alphabetical)
- File Name
- name of the source file (alphabetical)
- Calls
- number of calls to this function (numerical)
- Time
- execution time spent in this function
- Cost
- execution time spent in this function and all functions called from this function
- Coverage
- percentage of lines in this function that were executed
- Time/Call
- ratio of Time and Calls
- Messages
- for HPF profiles, the number of messages sent and received
- Messages Sent
for HPF profiles, the number of messages sent- Messages Received
for HPF profiles, the number of messages received- Bytes
- for HPF profiles, the length of all messages sent and received in bytes
- Bytes Sent
- for HPF profiles, the length of all messages sent in bytes
- Bytes Received
for HPF profiles, the length of all messages received in bytes
14.2.2.4 Select Menu And The Select Option Box
The Select menu and the Select option box in the Sort/Select area allow you to select a subset of the functions by any one of several properties. The Select menu and Select option box give the same functionality. The Select menu is not available for line-level windows. The selection options are:
- All
- all functions are displayed
- Calls
- only functions with more than N calls are displayed. Setting the value N is described at the end of this subsection.
- Time
- only functions taking more than N% of the total execution time are displayed. Setting the value N is described at the end of this subsection.
- Coverage
- only functions with coverage less than N% coverage are displayed. Setting the value N is described at the end of this subsection.
- Executed
- only functions that were actually executed are displayed.
- Unexecuted
- only functions that were never called are displayed.
The value N used in the description of Calls, Time and Coverage above can be set by typing into the text window in the Sort/Select area or by clicking on the up/down arrows next to that text window.
14.2.2.5 Processors Menu
For HPF profiles, the Processors menu allows you to choose which processor data to display. One or more options may be selected. The options are:
- Maximum
- displays the maximum value (time, cost, calls, count, etc.) from among all processors.
- Average
- displays the average value of all processors.
- Minimum
- displays the minimum value from among all processors.
- Sum
- displays the sum of values for all processors.
- All
- displays data for each processor for each functions or lines display. One line is used for each processor. Note: if many processors were used, the display can be quite long.
- Individual
- opens a selection window allowing you to select individual processor data to display.
- None
- None turns off individual processor displays. Note that only one of All, Individual and None may be selected.
14.2.2.6 View Menu
The View menu lets you select which data to display. The data that may be viewed for functions is:
- Filename
- name of the source file containing the function.
- Line Number
- line number where the function starts in the source file.
- Name
- name of the function.
- Processor
- for HPF profiles, the processor number to which this data line corresponds, or the string "max", "avg", "min" or "sum".
- Calls
- number of calls to the function. This may be displayed numerically or as a bar chart.
- Time
- time spent in this function. This may be displayed numerically in seconds or as a percent of total time; or it may be displayed as a bar chart. It may also be displayed as Time Per Call numerically in milliseconds or as a bar chart.
- Cost
- time spent in this function and all functions called from this function. This may be displayed numerically in seconds or as a percent of total time; or it may be displayed as a bar chart.
- Coverage
- number of lines that were actually executed. This may be displayed numerically as a line count or as a percent of actual coverage; or it may be displayed as a bar chart.
- Messages
- for HPF profiles, the number of messages total, or sent, or received; all either numerically or as a bar chart. Additionally, messages that were executed on the same processor as copies may be displayed numerically or as bar charts.
- Bytes
- for HPF profiles, the total length of all messages in bytes, or messages sent, or messages received; all either numerically or as bar charts. Additionally, the bytes count for messages that were executed on the same processor as copies may be displayed.
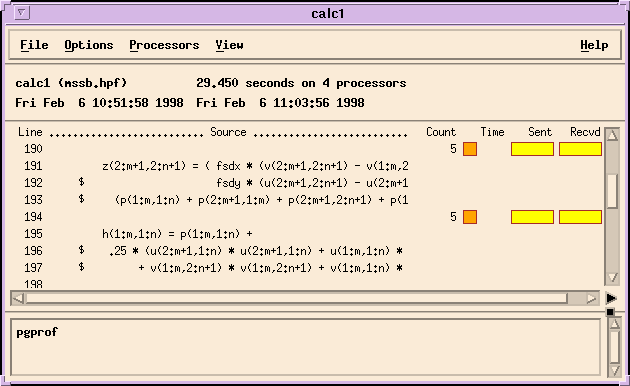
Figure 14-2
The illustration above shows an individual source line window. Selecting a function name from the function-level profile window and invoking it, usually by double-clicking will cause a line-level source window to be displayed. The data that may be viewed for individual source lines is:
- Line Number
- line number in the file.
- Stmt/on/Line
for programs with multiple statements on one line.- Source
- the program source text.
- Processor
- for HPF profiles, the processor number to which this data line corresponds, or the string "max", "avg", "min", "sum".
- Counts
- the number of times this line was executed. This may be displayed numerically or as a bar chart.
- Time
- the time spent executing this line. The Seconds may be displayed numerically, as a percent of total time, or as a bar chart. Alternately, Time per Count may be displayed numerically in milliseconds or as a bar chart.
- Cost
- time spent executing this line and all functions called from this line. This may be displayed in Seconds, as a Percent of Cost or as a Bar Chart.
- Messages
- for HPF profiles, the number of messages total, or sent, or received; all either numerically or as a bar chart. Additionally, messages that were executed on the same processor as copies may be displayed numerically or as bar charts.
- Bytes
- for HPF profiles, the total length of all messages in bytes, or messages sent, or messages received; all either numerically or as bar charts. Additionally, the bytes count for messages that were executed on the same processor as copies may be displayed.
14.2.2.7 Help Menu
The Help menu has two options:
- About
- this option opens a window giving version information about PGPROF.
- Index
- this option starts up a WWW browser (Netscape) to interactively browse the PGPROF help page.
14.3 Command Language
The interface for non-GUI versions of the PGPROF profiler is a simple command language. This command language is available in GUI versions of the profiler using the -s option. The language is composed of commands and arguments separated by white space. A pgprof> prompt is issued unless input is being redirected.
14.3.1 Command Usage
This section describes the profiler's command set. Command names are printed in bold and may be abbreviated as indicated. Arguments contained in [ and ] are optional. Separating two or more arguments by | indicates that any one is acceptable. Argument names in italics are chosen to indicate what kind of argument is expected. Argument names which are not in italics are keywords and should be entered as they appear.
- d[isplay] [display options] | all | none
Specify display information. This includes information on minimum values, maximum values, average values, or per processor data.- he[lp] [command]
Provide brief command synopsis. If the command argument is present only information for that command will be displayed. The character "?" may be used as an alias for help.h[istory] [ size ]
Display the history list, which stores previous commands in a manner similar to that available with csh or dbx . The optional size argument specifies the number of lines to store in the history list.- l[ines] function [[>] filename]
Print (display) the line level data together with the source for the specified function. If the filename argument is present the output will be placed in the named file. The '>' means redirect output, and is optional.lo[ad] [ datafile]
Load a new dataset. With no arguments reloads the current dataset. A single argument is interpreted as a new data file. With two arguments, the first is interpreted as the program and the second as the data file.m[erge] datafile
Merge the profile data from the named datafile into the current loaded dataset. The datafile must be in standard pgprof.out format, and must have been generated by the same executable file as the original dataset (no datafiles are modified.)pro[cess] processor_num
For HPF profiles, specify the processor number of the data to display.- p[rint] [[>] filename]
Print (display) the currently selected function data. If the filename argument is present the output will be placed in the named file. The '>' means redirect output, and is optional.q[uit]- Exit the profiler.
- sel[ect] coverage | covered | uncovered | all [[<] cutoff]
This is the coverage mode variant of the select command. The cutoff value is interpreted as a percentage and is only applicable to the coverage option. The '<' means less than, and is optional. The default is coverage < 100%.sel[ect] calls | time/call | time | cost | all [[>] cutoff]
You can choose to display data for a selected subset of the functions. This command allows you to set the selection key and establish a cutoff percentage or value. The cutoff value must be a positive integer, and for time related fields is interpreted as a percentage. The '>' means greater than, and is optional. The default is time > 1%.- sh[ell] arg1, arg2, argn...
For a shell using the given arguments.- so[rt] [by] calls | time/call | time | cost | name
(Profile Mode) Function level data is displayed as a sorted list. This command establishes the basis for sorting. The default is time.so[rt] [by] coverage | name
This is the coverage mode variant of the sort command. The default is coverage, which causes the functions to be sorted based on percentage of lines covered, in ascending order.src[dir] directory
Add the named directory to the source file search path. This is useful if you neglected to specify source directories at invocation.s[tat] [no]min|[no]avg|[no]max|[no]proc|[no]all]
Set which HPF fields to display or do not display with the no versions.t[imes] raw | pct- !!
- repeat previous command.
- ! num
- repeat previous command numbered num in the history list.
- !-num
- repeat the num-th previous command numbered num in the history list.
- ! string
- repeat the most recent previous command starting with string from the history list.
<< " border=0>
> " border=0>